Embedded Analytics GTM — cover
All projects

Embedded Analytics GTM

One connected story from first touch to activation, built to lift demo and trial requests.

Role

Senior UX Designer, Growth

Client

GoodData

Industry

Analytics · B2B SaaS

Duration

Full-funnel GTM

I owned the UX for GoodData's embedded-analytics go-to-market as one connected journey, from paid and organic acquisition through landing page, lifecycle email, and an in-product tour. Mixed-methods research pinpointed where the funnel leaked; a series of design and experiment decisions then lifted demo and trial requests.

Overview

Embedded analytics is sold mostly to product and engineering leaders, and it's bought, or abandoned, based on one question: how hard will this be to embed?

Rather than redesign a page, I treated the whole GTM as a single experience: one narrative carried across the ad, the landing page, the email, and the activation asset, so the prospect never lost the thread.

Full funnel

Acquisition to activation, one journey

Mixed-methods

Funnel-cohort analysis plus interviews

↑ Requests

Demo and trial requests lifted (figures under NDA)

The problem

Embedded analytics has a specific buying friction: prospects can't tell how hard it'll be to embed into their own product. They read, hesitate, and leave before requesting a demo or trial.

A landing page alone doesn't fix it. When the ad, page, email, and tour each tell a slightly different story, the funnel leaks between touchpoints and the prospect loses the thread.

"The goal wasn't to redesign the page. It was to lift requests by making one low-friction story carry from first touch to activation."

What I owned

I owned the funnel and flow, the research, the experimentation, and the conversion and performance work, aligned with acquisition.

Funnel & flow

The connective tissue, message, visual story, and CTA, across every surface.

Research

Mixed-methods: funnel-cohort analysis across channels, plus qualitative interviews.

Experimentation

An A/B test of an interactive product tour against an explainer video.

Conversion & performance

A landing-page performance fix and a search / AEO keyword realignment.

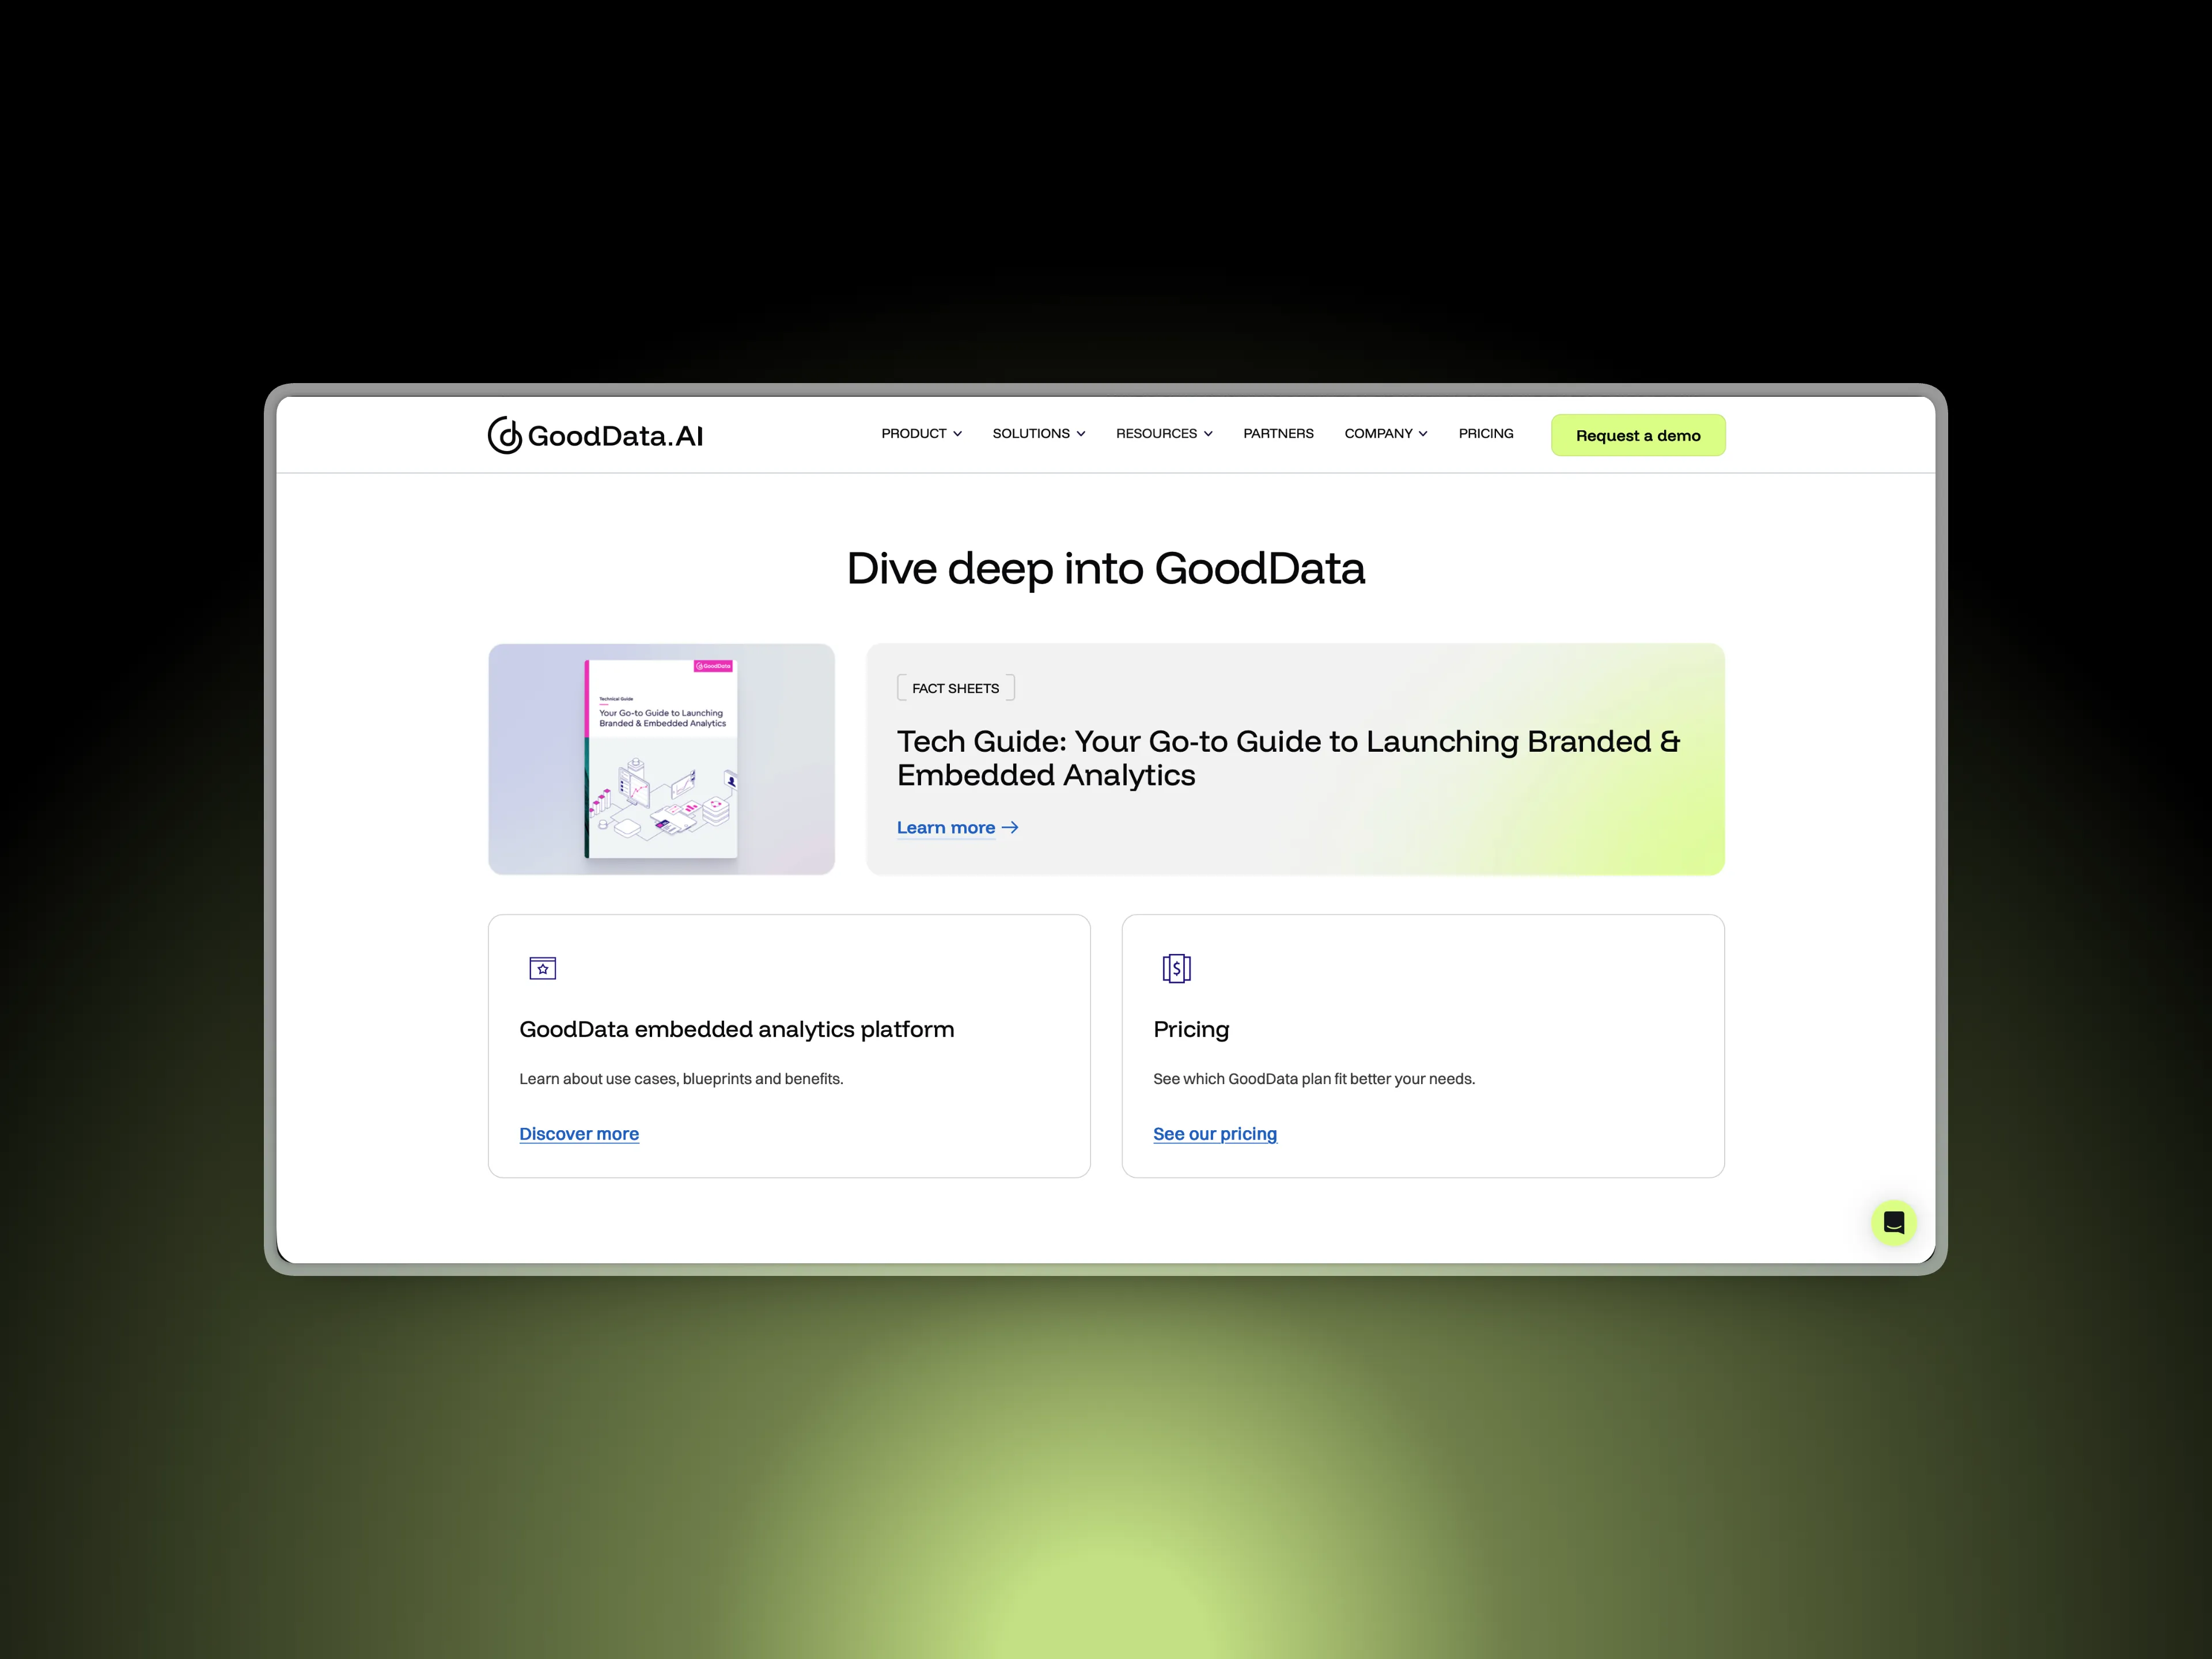
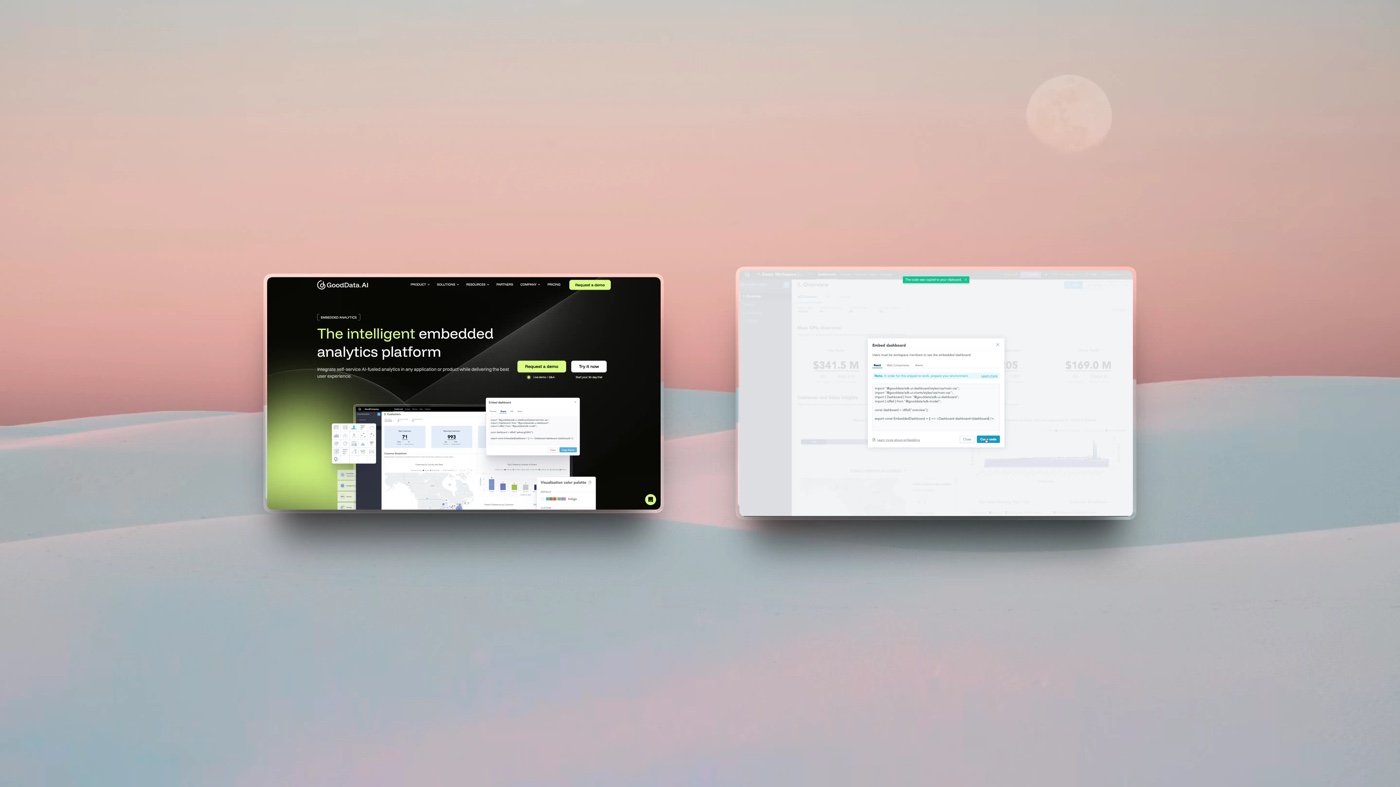
One connected funnel, not separate assets

The ad, landing page, email, and tour were owned and built as separate things, so they risked telling different stories, and prospects dropped in the gaps between them.

I treated the GTM as a single experience orchestrated around one narrative, and designed the connective tissue, message, visual story, and CTA, to carry across every surface. A funnel only converts when the story holds from first touch to activation.

Tradeoff

Tighter coordination across teams and channels: you can't change one asset in isolation without checking the others.

Two screens: a GoodData embed-dashboard modal showing React, Web Components, and iFrame code options, alongside the embedded-analytics landing page headlined 'Choose your ideal embedded analytics solution.'
One story carried across the landing page and the in-product embed experience.

Find the leak before fixing it

"Increase requests" is a goal, not a diagnosis. We didn't know where intent was being lost, so I ran quantitative funnel-cohort analysis to see where each cohort dropped, paired with interviews to understand why.

Then I prioritized fixes against the real drop-off points the data surfaced, not assumed ones, so the later bets actually paid off.

Tradeoff

Slower than shipping on intuition, accepted, because guessing at the wrong friction wastes the redesign. (Research findings are under NDA.)

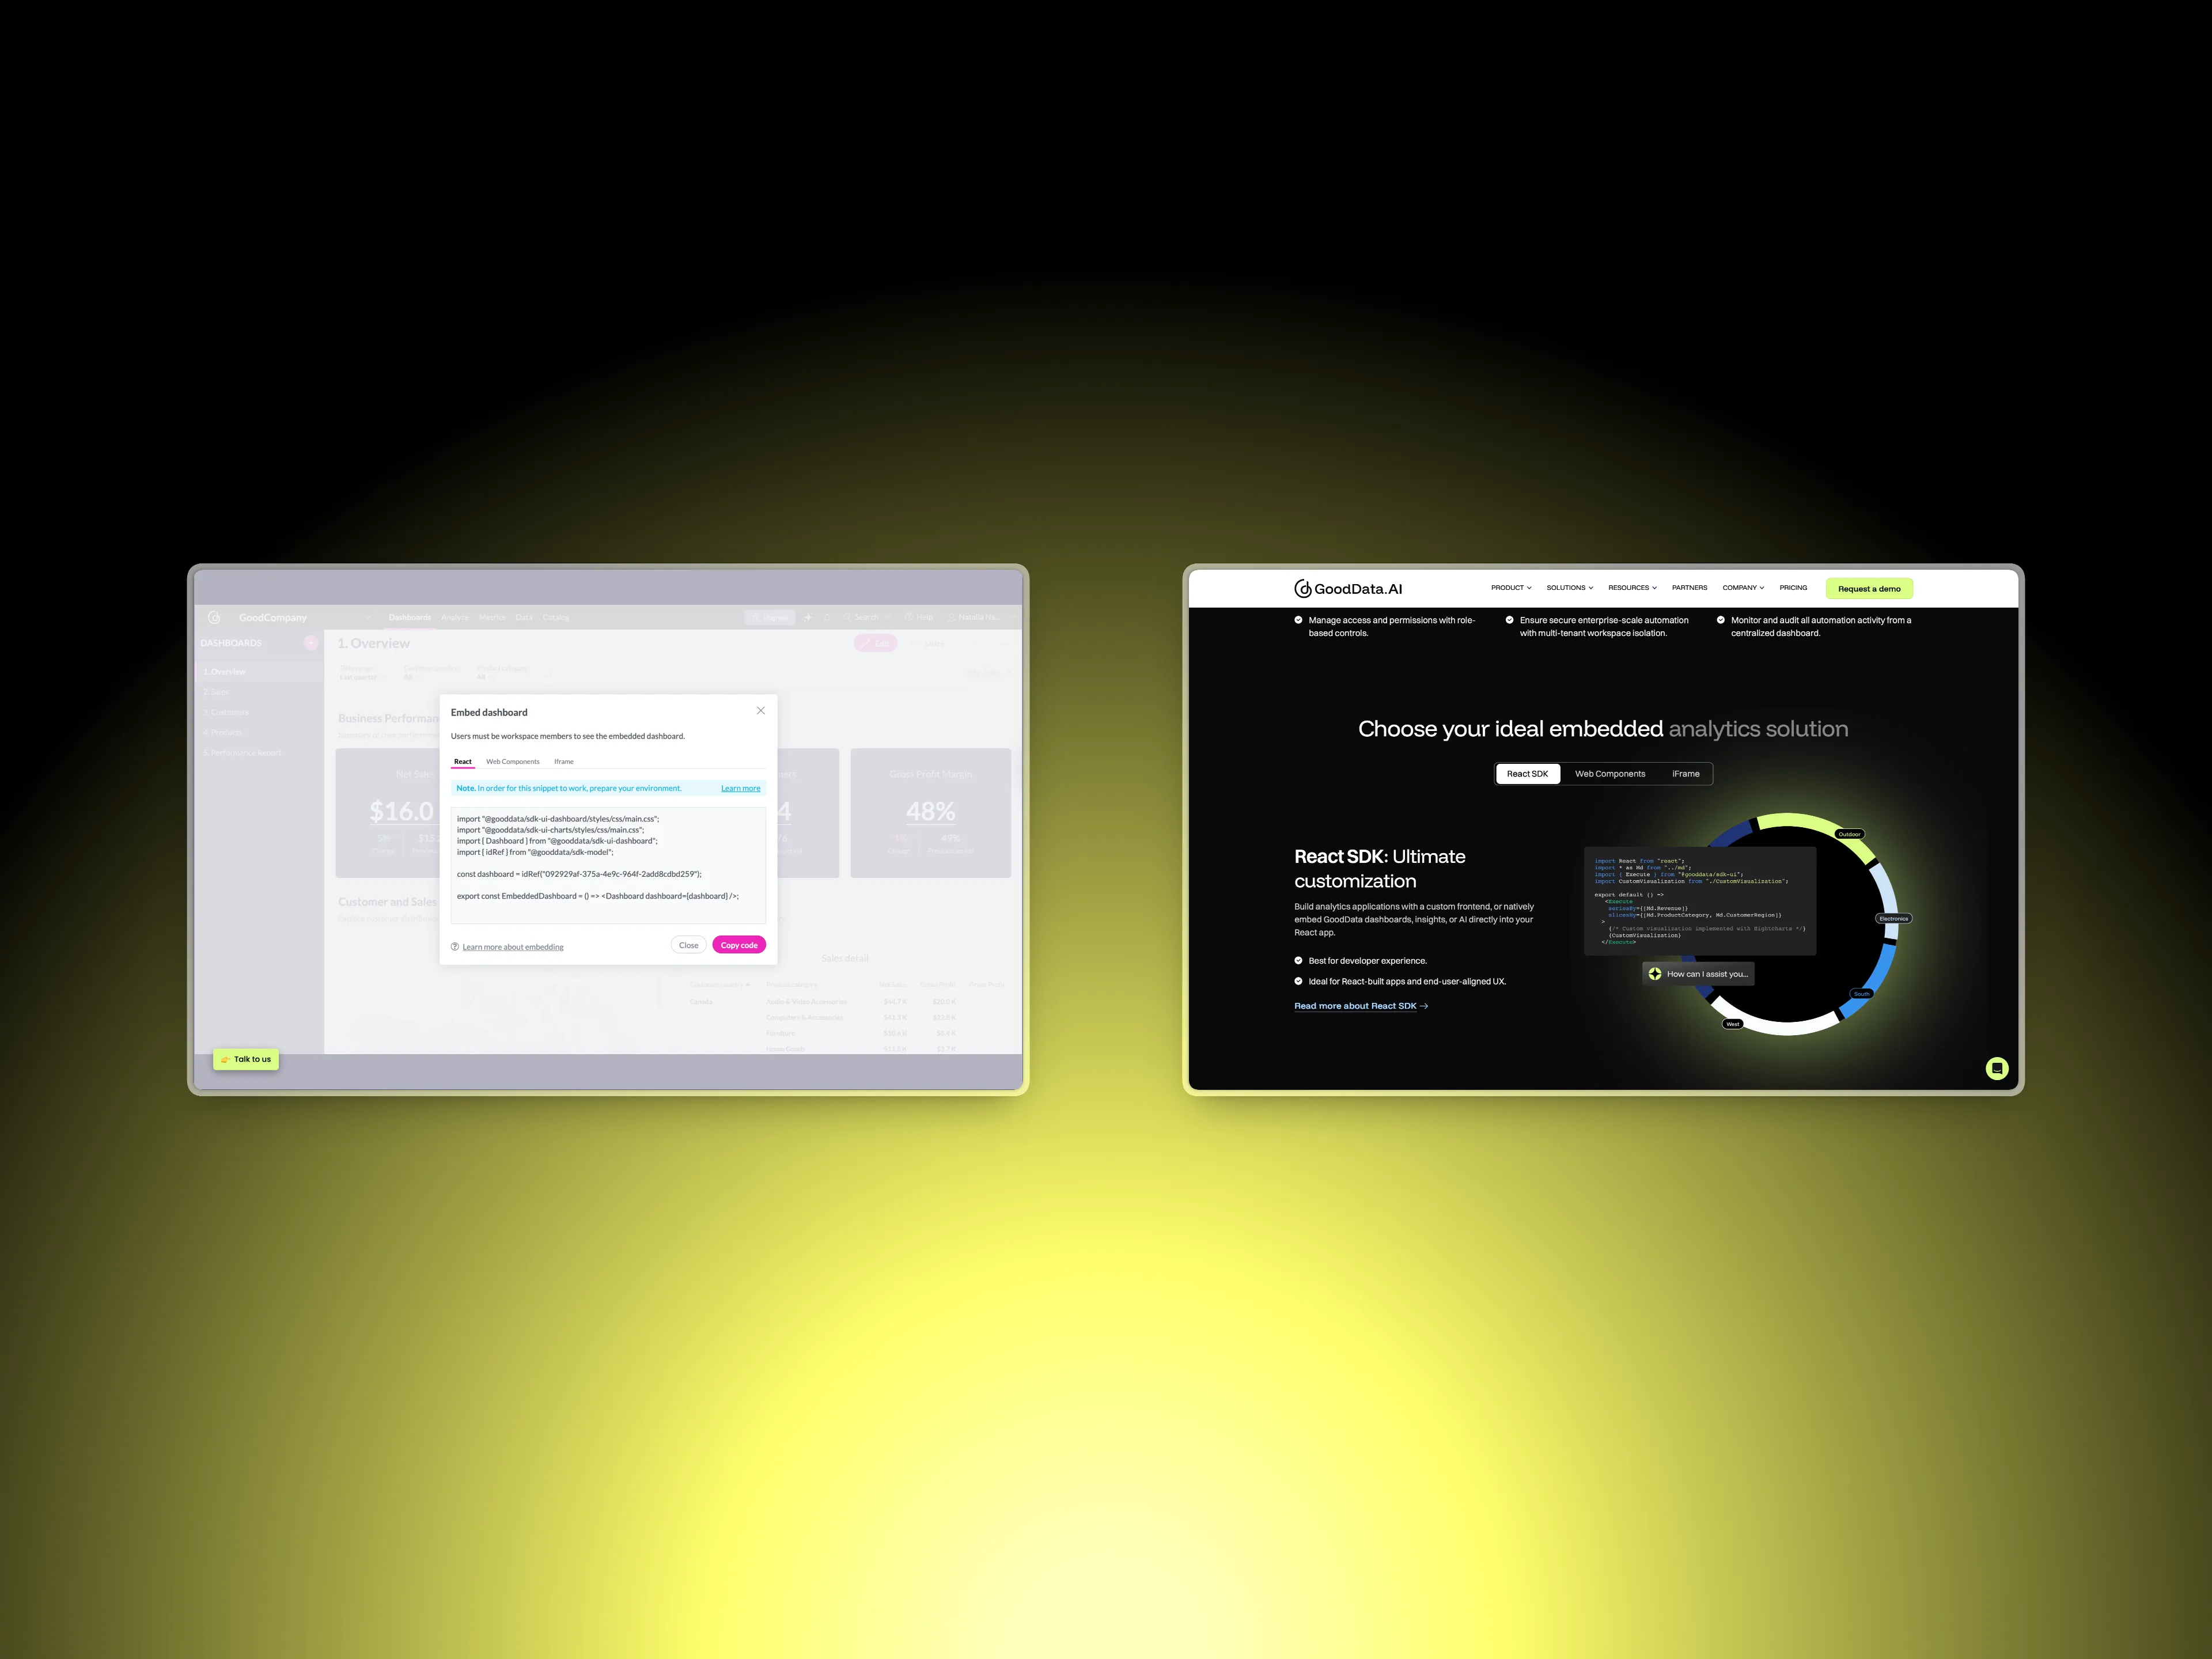
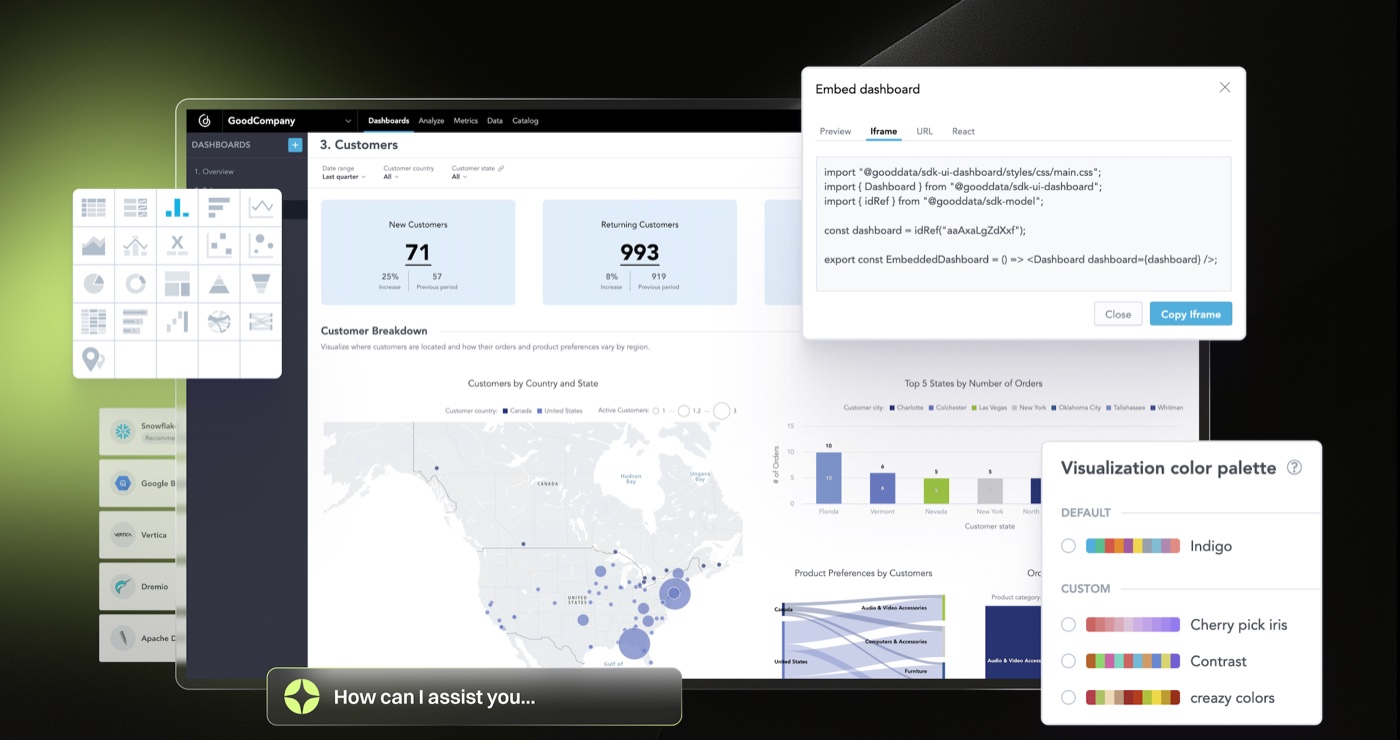
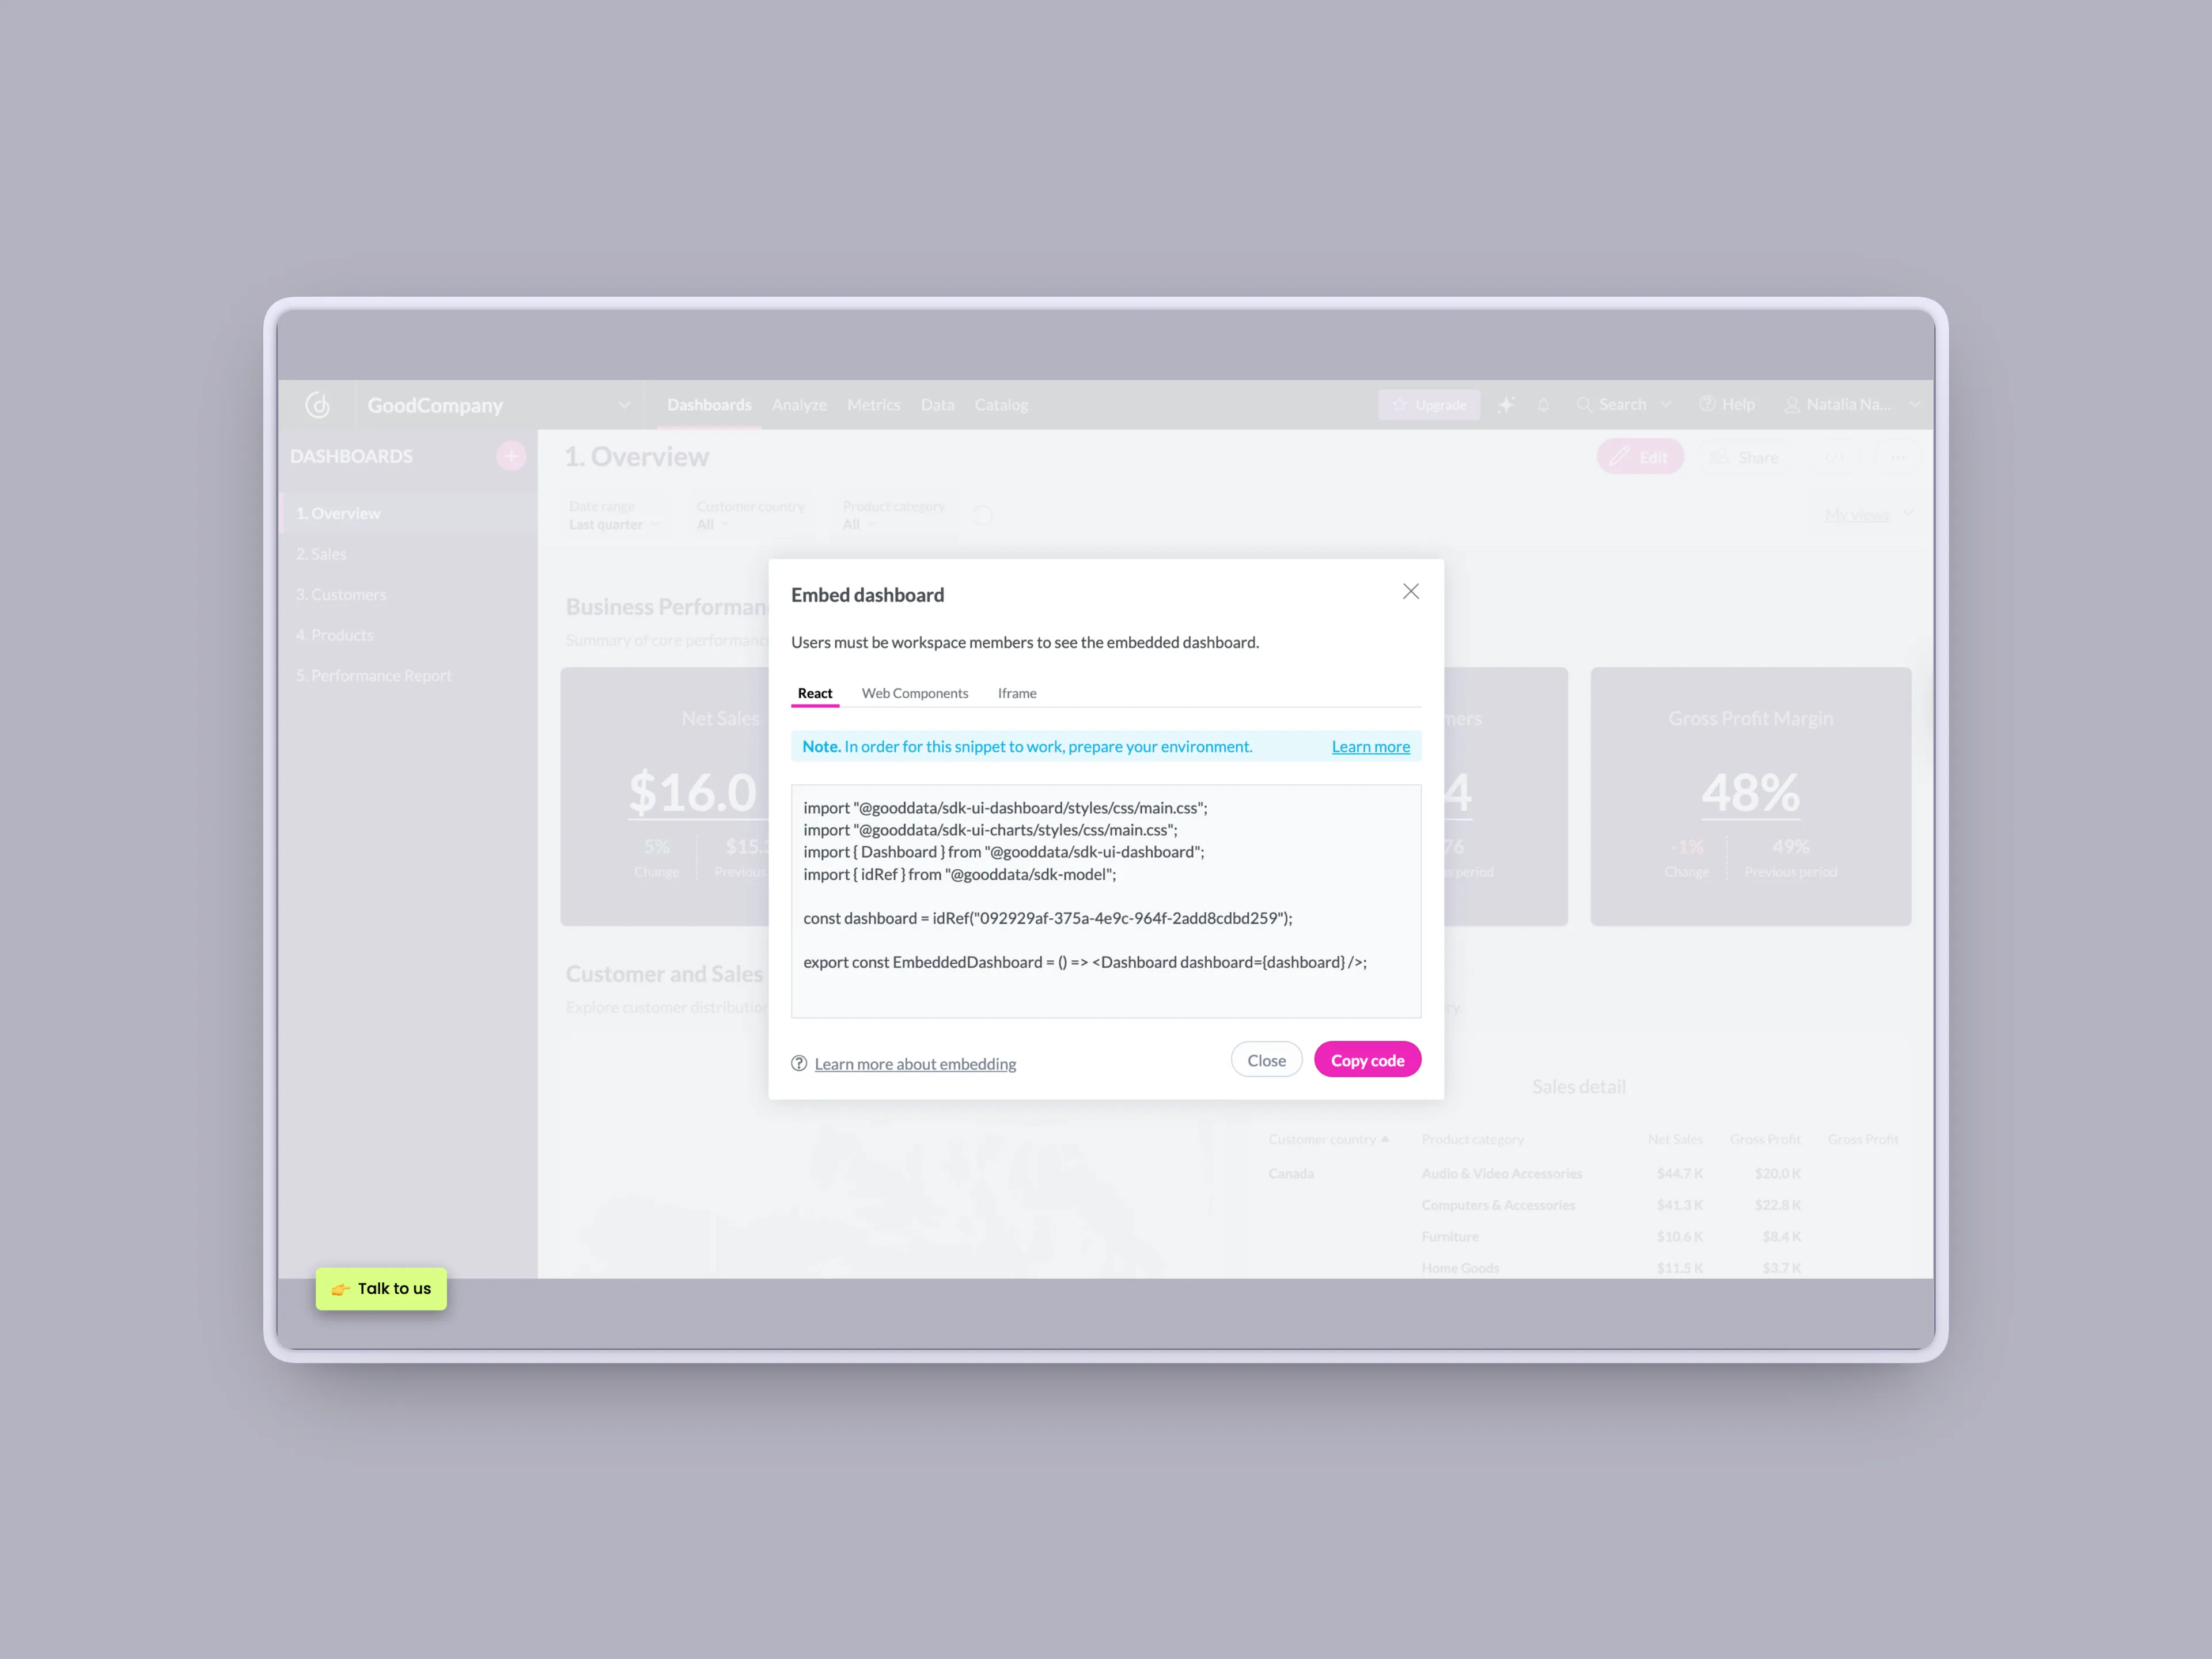
Answer the real friction: how hard is it to embed?

The real blocker needed a consistent answer, not one buried on a single page. So the "low-effort embedding" message ran across ad copy, the landing page, the email, and the activation asset, each surface reinforcing the same reassurance.

On the product side, the embed experience itself does the convincing: a few lines of code, with React, Web Components, and iFrame options for however the prospect builds.

An 'Embed dashboard' modal showing a short React code snippet with import statements and a copy-code button, illustrating how little code embedding requires.
The real question, "how hard is this to embed?", answered in a few lines of code.

Tour vs video: relevance beats interactivity

My hypothesis was that an interactive tour would win, show-by-doing usually lowers perceived effort better than a passive video. We A/B tested both. The video won.

It won because the tour included content outside embedded analytics, which made it longer and added irrelevant friction. The video stayed tightly scoped to "how to embed," and the focused asset converted better.

"Relevance and scope beat interactivity. A bloated asset loses to a focused one, even a passive one."

Tradeoff

Video adapts less to follow-up intent than a tour, so the next iteration is a scoped tour that strips the off-topic content and re-tests.

Speed and search as conversion levers

The hero animation was degrading load on the single most important conversion surface, so I replaced it with a static image. Page speed is a conversion lever, not just polish.

Upstream, I realigned keywords to both traditional search and AEO intent, so the right, higher-intent prospects enter the funnel before any on-page work has to compensate.

Tradeoff

SEO and AEO shifts compound slowly and need ongoing maintenance as query behavior changes.

Re-engage with lifecycle

Not every prospect converts on the first visit. A nurture sequence re-surfaced the embedding story and routed back to the demo or trial request, keeping people inside the same narrative.

Lower- and top-of-funnel assets, fact sheets, platform overviews, pricing, gave returning evaluators a reason to come back and convert.

A 'Dive deep into GoodData' resources section with a tech-guide fact sheet, an embedded-analytics platform overview card, and a pricing link.
Lower- and top-of-funnel assets to re-engage returning evaluators.
An embedded analytics dashboard inside a host application, with an embed-code modal and a visualization color-palette customization panel.
The embedded product: dashboards and visualizations, brandable, inside a customer's app.